
When an earthquake occurs, we must know what its records are to be able to intuit if there may be more aftershocks. The place where the movement of the ground is recorded is the seismogram. The seismogram is the graph where the records measured by the seismograph are recorded. The main function of the seismograph is to measure the speed and type of seismic wave produced during an earthquake.
In this article we are going to tell you how seismogram works and what is the importance of earthquake records.
How an earthquake forms
The first thing is to know how an earthquake is formed. As we know, the earth's crust is divided into tectonic plates. The interaction between these tectonic plates is the main cause of earthquakes. Nevertheless, is not the only one. Any process that can achieve large amounts of energy contained in the rocks is enough to generate earthquakes. The size of such earthquakes will depend on the area of stress concentration and other factors.
We are going to talk now about what are the factors that can cause an earthquake:
- Tectonic plates: As we have mentioned before, there are numerous earthquakes that originate from the displacement of some tectonic plates that make up the earth's crust. These earthquakes generate various types of waves that are recorded by a seismograph and captured in a seismogram. These earthquakes normally affect large areas of land and it is the one that most frequently causes problems.
- Volcanic: it is a less frequent origin but it can also cause an earthquake. If the eruption of a volcano is violent, it can generate great shocks that affect all nearby places. Despite the fact that it can generate earthquakes, its field of action is much smaller if we compare it with that of tectonic origin.
- By sinking: if the continuous erosive action of groundwater has taken place inside the crust, they leave a vacuum and end up giving up the weight of the upper part. This fall of the earth is generating vibrations known as earthquakes. Their frequency is very low and they affect to a very small extent.
- Landslides: It may also happen that the weight of the mountain itself can produce some earthquakes by causing landslides along the faults. They are generally not large earthquakes, but rather small waves.
- Atomic explosions: They are carried out during human experiments on atomic bombs. Apparently it has been possible to verify that there is a correlation between seismic movements and the explosion of atomic bombs.
What is a seismogram
When the earthquake starts sending waves from the hypo center to the epicenter, a device known as a seismograph is responsible for measuring the magnitude of these waves. The record of all seismic waves are noted on the seismogram. Seismogram can collect all the information of an earthquake. In it, the hours, intensity, speed and distance at which the earthquake takes place are recorded.
Because the speeds of different types of waves are different, they can give great information about the earthquake itself. The P waves are those primary that have a greater speed. S waves are those that travel at a slower speed. They are called surface waves. The difference between the speeds of each type of wave is the one used to determine the location of the earthquake's focus.
How we measure an earthquake
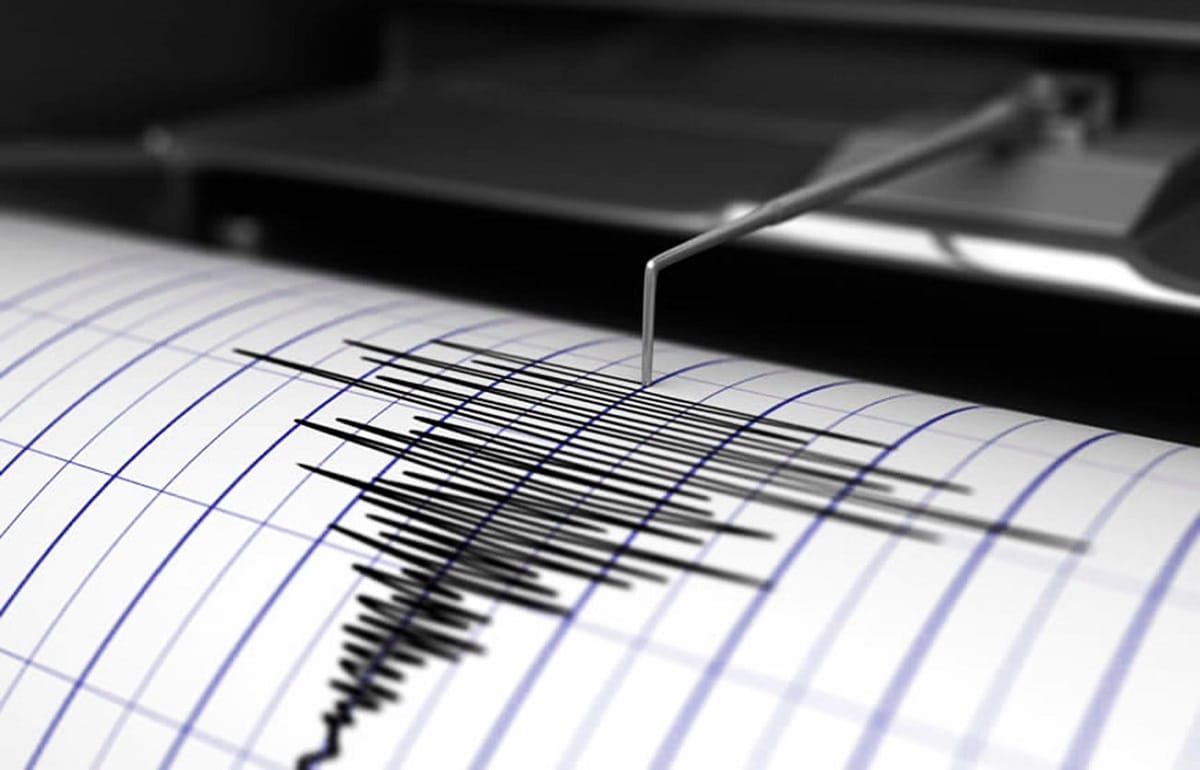
The energy of the earthquake is traveling in the form of vibrations. These seismic waves are registered thanks to the seismograph. This device will indicate the intensity and magnitude of the vibrations of the seismic waves. The seismogram is pointing a whole series of zig-zags on the paper where, finally, all the intensity of the waves that the earthquake has had will be represented.
This is where we can see the time, location and intensity of the earthquake based on the information revealed by the seismogram. It can also reveal information about the type of rock through which the seismic waves passed.
The seismogram measurements belong to the Richter scale. This magnitude scale was created in 1935 by the seismologist Charles Richter and the values range from 1 to the open end. This quantitative measurements. It is responsible for measuring the seismic energy that is released in each earthquake regardless of its intensity. Its measurement is based mainly on the amplitude of the wave that the seismogram records.
Until today, this is the best known and most used way to classify earthquakes. In theory there are no limits on this scale, but a scale of 9 already means total destruction. The largest earthquake that has happened in history took place in Chile in 1960 and reached 9.5 on the Richter scale.
Seismograms record the natural or artificial movement of the ground. This natural movement is due to the continental drift of the tectonic plates. Both friction, friction between the surrounding materials is today fracturing of the materials releases energy in different ways. These forms are usually by seismic waves. The speeds with which these oscillations travel through the medium can be of great information to know the hypocenter of the earthquake. All these oscillations can be seen in a seismogram.
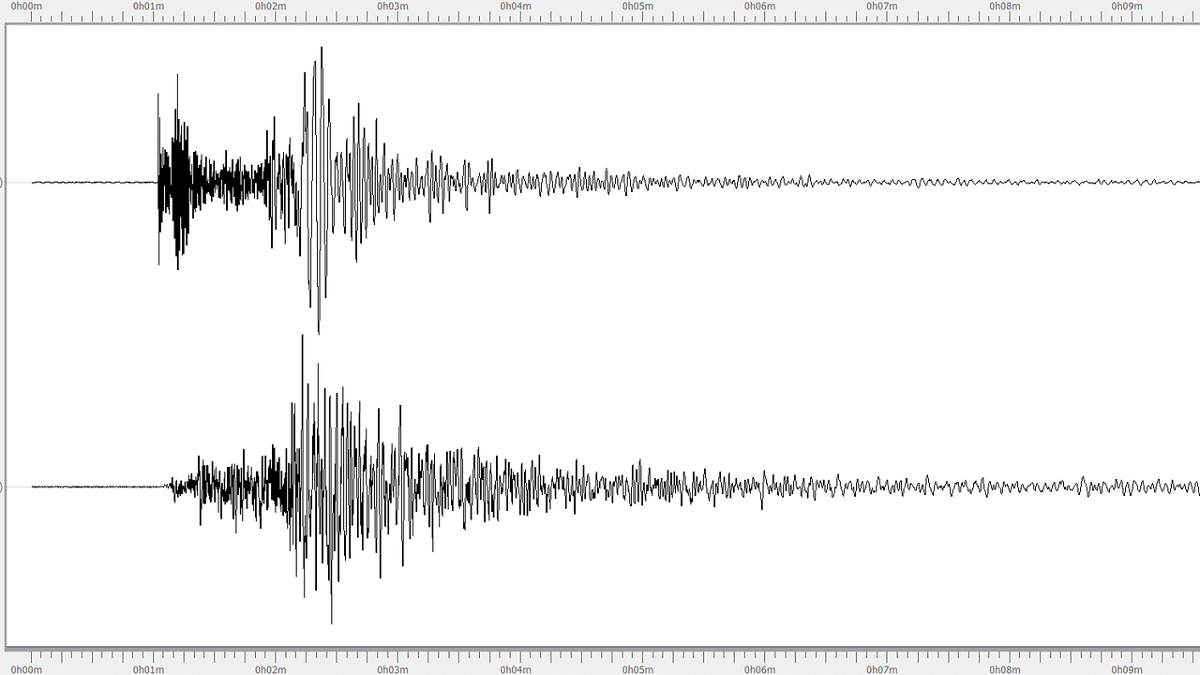
The seismometer has two components: a horizontal and a vertical. It is capable of registering the signal with its two components in addition to a third that is vertical. The purpose is power determine the correct speed of seismic waves and be able to properly locate the hypocenter of the earthquake. Knowing the hypocenter of the earthquake, it is possible to know that the epicenter will be located vertically.
Seismogram and record
With the seismogram, the speed of seismic waves can be visualized, which are usually surface waves or body waves (P waves and S waves). The first wave registered is the P since it is the one with the highest speed.
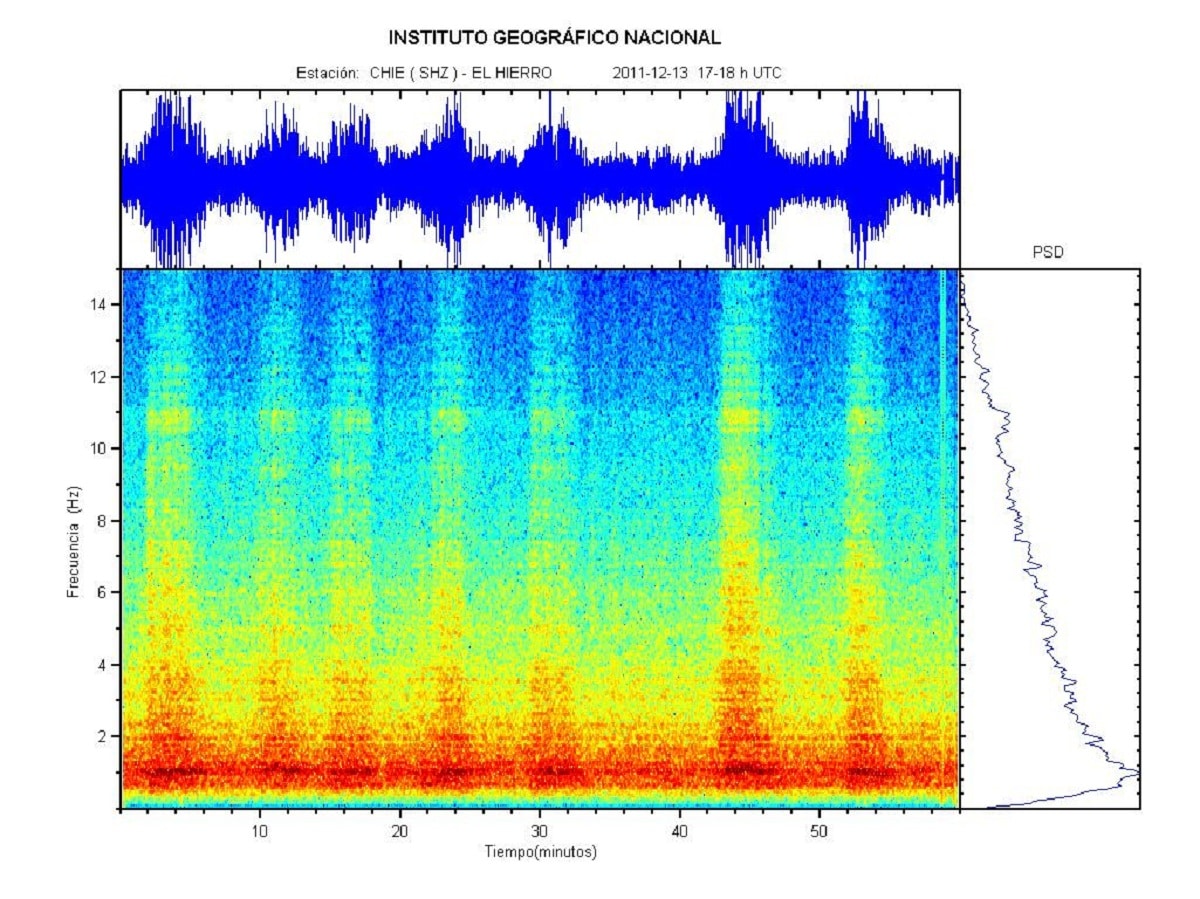
According to the type of seismic event there are several types of seismogram. There are seismograms for local, regional, teleseismic events, nuclear explosions, large earthquakes, volcanic movement and volcanic earthquakes. All these types generate different signals with their own characteristics that help the seismogram reveal what type of event has occurred.
I hope that with this information you can learn more about the seismogram.