
Seeing the weather is something we do on a daily basis. However, we may not understand well when the weatherman points to the map. We see the map of Spain with many lines, symbols and numbers. What do all those signs refer to?
Here you can learn everything you need to know to read the weather map and understand it perfectly. You just have to keep reading and ask if you have doubts 🙂
Basic principles of the weather map

Weather maps offer us a fairly simplified representation of the current or forecast weather situation in an area. The most common is to analyze the surface, since that is where the weather affects us. The general concepts of meteorology are easy to understand. Most people need information about himas rainfall, winds, if there are storms, hail, snow, etc.
These aspects are quite important when it comes to understanding time. What it takes for it to rain, why it happens, and at what intensity it will. To understand the operation of many meteorological variables it is vitally important to know atmospheric pressure. Atmospheric pressure, in most cases, determines the weather. In places where the atmospheric pressure is higher, good and dry weather prevails. On the contrary, if it is lower, there will be a more humid air and bad weather.
Importance of atmospheric pressure
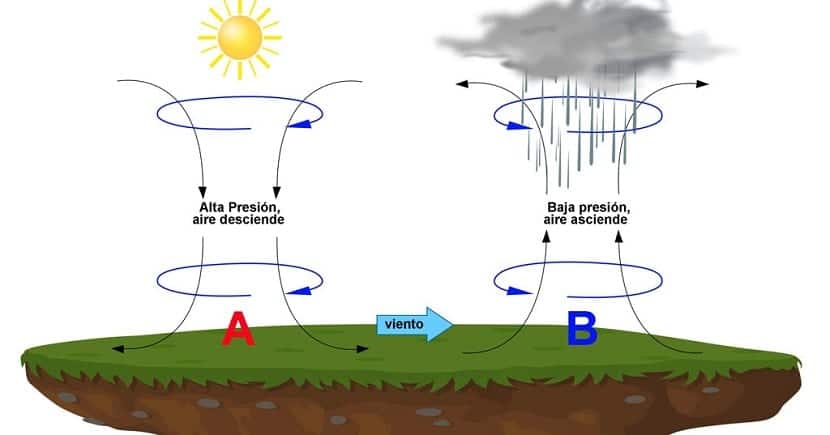
When there is a higher pressure system it is about a denser air mass. This is because the air is cooler and drier than the surrounding air. When this happens, the heavier air falls off the pressure system. At these times, it is when you have good weather and with few clouds.
On the other hand, when we have a lower pressure system, it means that the air mass is less dense. This is because the air is more humid or hotter. Thus, the surrounding air goes inwards, to the center of the system, while the light air goes upwards. When light, warm air rises and encounters cooler layers, it condenses into clouds. As the clouds grow vertically, the famous precipitation clouds form.
In systems where the pressure is very low storms are formed. These clouds are going to form and move across the sky. For these clouds to form, the hot, humid air has to rise high enough to generate vertical development.
When you see a weather map try to analyze how they measure pressure. It is about measuring what the air weighs on the ground. The unit of measurement is the millibar. This is important to know given that many weather patterns are associated with atmospheric pressure. The mean value of the pressure at sea level is 1013 mb. When we have a high pressure system, it usually reaches values of 1030 mb. However, when the system is low pressure, the values can drop to around 1000 mb or even less.
Symbols on the weather map

To learn the most important symbols on the weather map, you have to be attentive to the pressure symbols. To read the surface barometric pressure, check the isobars. These are lines that mark the same value of atmospheric pressure for different places. That is, if we see a map where the isobar lines are very close to each other, there will be bad weather. This is because in a short distance, the pressure values are changing. Therefore, there is atmospheric instability.
The isobar lines mark the speed and direction of the wind. The winds are directed from areas where there is more atmospheric pressure to where there is less. Therefore, we can know this information just by analyzing the values of the isobars. When we see the isobars placed in smaller circles, the center indicates a center of pressure. It can be both high, with the symbol A, and low, with the symbol B.
We must know that air does not flow down pressure gradients. It moves around them due to the Coriolis effect (of the Earth's rotation). Therefore, the isobars that are in a clockwise direction are anticyclonic flows and the opposite are cyclonic flows. An anticyclone is synonymous with high temperatures and good weather. The cyclone is atmospheric instability that translates into a storm. The closer the isobars are to each other, the stronger the wind speed.
Interpretation of a low and high pressure system
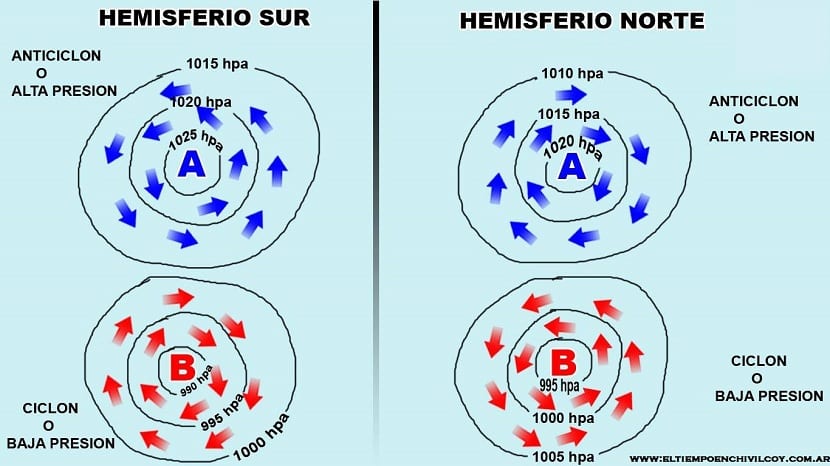
When a cyclone occurs it is usually accompanied by storms with an increase in clouds, winds, temperatures and rainfall. This is represented on the weather map with closely packed isobars. Arrows travel counter-clockwise in the northern hemisphere and with a "T" in the middle isobar.
High pressure conditions do not represent rain. The air is drier and they are represented by an H in the middle isobar. The arrows circulate in the direction of the wind. In a clockwise direction in the northern hemisphere.
Front types
In the meteorological maps that they show us on television, the fronts can be seen indicated. If the fronts pass through an area, it is very likely that the weather will vary. Mountains and large bodies of water can distort your path.
There are several types of fronts and they are represented on the weather map by different symbols. The first is the cold front. When a cold front passes through an area, it is very likely that the rainfall will be torrential and with strong wind. On weather maps they are represented by blue lines and triangles on the side of the direction of movement from the front.
The second type is the warm front. IIt implies an increase in temperatures as it approaches. The sky clears quickly as the front passes. If the hot air mass is unstable, some storms can occur. They are represented on the weather map with red lines and semicircles on the side where they are going.
The last type of is an occluded front. It is formed when a cold front overtakes a warm one. They are associated with some meteorological effects such as storms. There may be a warm or cold occlusion. When an occluded front comes in, the air becomes drier. They are represented by a purple line and semicircles and triangles in the direction of the wind.
I hope that with this information you can learn to interpret the weather map. Any questions, leave it in the comments. We will gladly answer Respon
Thank you very well explained, I have been hooked on learning to interpret time well.
Thank you very much for the video and the text. I have learned a lot and have been wanting more examples.
With the storm that you mentioned is located in northern Italy, taking into account the direction of the wind that it would cause, when the air comes from continental Europe, would it be dry air with less probability of rain?
Thank you!